728x90
반응형
Python을 공부하면서 배운 것들을 활용하여 머신러닝 대시보드를 개발해 보는 실습을 해보자.
이번 실습은 Pycharm (Python 3.9)에서 진행하였다.
목차
1. 사용한 모듈
2. 구상하기
3. Main 페이지가 될 app.py 파일 생성
4. Main 페이지에 들어갈 내용 만들기
5. EDA (탐색적 자료분석) 메뉴
6. ML(머신러닝) 학습 모델 생성
7. ML(머신러닝) 메뉴
8. 모든 페이지를 Main 페이지에 적용하기
9. 실습을 마치며
1. 사용한 모듈
- Matplotlib과 Seaborn, Plotly를 이용하여 시각화
- Streamlit을 활용한 웹 배포
- Scikit-Learn을 활용한 머신러닝 모델 생성
- 그 외 pandas, joblib, os, numpy 활용
2. 구상하기
Streamlit을 통해 웹 배포를 할 것이기 때문에 어떻게 페이지를 만들 것인지 구상을 먼저 해보자.
- 우선 IRIS 데이터에 대한 기초정보, 통계분석, 산점도 등이 들어가야겠다.
- 사이드 바 생성을 통해 메뉴를 만들 생각이다.
- 메뉴로는 HOME, EDA, ML, ABOUT을 만들어보자.
- 그 외 자세한 것은 만들면서 생각해 보자.
자 그럼 실습을 시작할 차례!
2. 폴더 생성 및 데이터 넣기
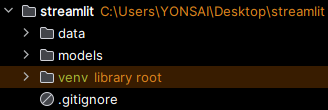
- Streamlit 폴더에 IRIS데이터와 생성할 머신러닝 모델을 저장할 data 폴더와 model 폴더를 생성한다.
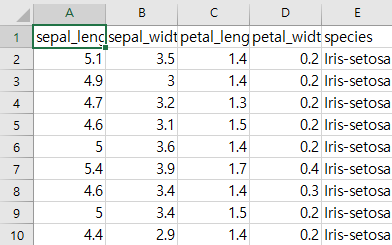
- data폴더 에는 실습에 필요한 iris.csv 파일을 넣어둔다. ( 데이터 다운로드 링크 - 출처 : Kaggle)
- 데이터 확인
3. Main 페이지가 될 app.py 파일 생성
- 이제 메인 페이지를 만들어 보자.
- 메인 페이지 구상
- 사이드 바 생성을 통한 메뉴 생성
- 프로젝트 설명, 프로젝트 목표, 데이터 출처 소개
- 메뉴에는 HOME, EDA, ML, ABOUT 생성
# -*- coding:utf-8 -*-
import streamlit as st					# streamlit 모듈 import

def main():						# 메인 페이지 함수 생성
    st.subheader("Choi's ML Project")			# 페이지 SubHeader 생성

    menu = ['HOME', 'EDA', 'ML', 'About']		# 메뉴에 들어갈 목록 작성
    choice = st.sidebar.selectbox("Menu", menu)		# 사이드 바에 SelectBox 생성

    if choice == 'HOME':				# HOME 페이지
        st.subheader('HOME')

    elif choice == 'EDA':				# EDA 페이지
        st.subheader('탐색적 자료 분석(EDA)')
        pass
    elif choice == 'ML':				# ML 페이지
        st.subheader('머신러닝(ML)')
        pass
    else:						# ABOUT 페이지
        st.subheader('About')


if __name__ == "__main__":				# 메인 페이지 실행
    main()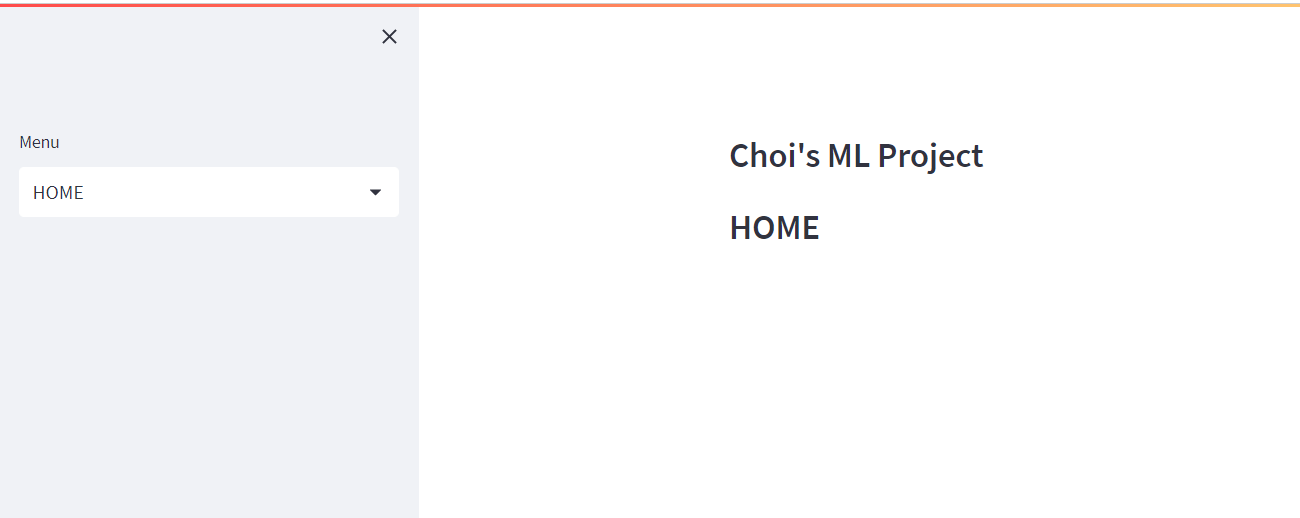
4. Main 페이지에 들어갈 내용 만들기
- utils.py를 만들어 메인 페이지에 들어갈 설명 작성
- app.py에서 utils.py 내용 import 시키기
# utils.py
# -*- coding:UTF-8 -*-
p_lans = ['Python', 'Julia', 'Go', 'Rust']

html_temp = """
<style type="text/css">
.tg  {border-collapse:collapse;border-spacing:0;}
.tg td{border-color:black;border-style:solid;border-width:1px;font-family:Arial, sans-serif;font-size:14px;
  overflow:hidden;padding:10px 5px;word-break:normal;}
.tg th{border-color:black;border-style:solid;border-width:1px;font-family:Arial, sans-serif;font-size:14px;
  font-weight:normal;overflow:hidden;padding:10px 5px;word-break:normal;}
.tg .tg-0lax{text-align:left;vertical-align:top}
</style>
<table class="tg">
<thead>
  <tr>
    <th class="tg-0lax">강의명</th>
    <th class="tg-0lax">AI 플랫폼을 활용한 빅데이터 분석 전문가</th>
  </tr>
</thead>
<tbody>
  <tr>
    <td class="tg-0lax">교과목명</td>
    <td class="tg-0lax">기초문법</td>
  </tr>
  <tr>
    <td class="tg-0lax">프로젝트 주제</td>
    <td class="tg-0lax">파이썬 Streamlit 라이브러리를 활용한 IRIS 데이터 머신러닝 대시보드 개발</td>
  </tr>
  <tr>
    <td class="tg-0lax">프로젝트 마감일</td>
    <td class="tg-0lax">2023년 5월 15일</td>
  </tr>
  <tr>
    <td class="tg-0lax">이름</td>
    <td class="tg-0lax">최재명</td>
  </tr>
</tbody>
</table>
"""

dec_temp ="""
### IRIS 예측 모델 개발
- IRIS 데이터를 활용하여 간단한 EDA 및 예측 모델을 구현한다.
#### 데이터
    + https://www.kaggle.com/datasets/saurabh00007/iriscsv
"""
# -*- coding:utf-8 -*-
import streamlit as st
from utils import html_temp # utlis.py의 내용 import
from utils import dec_temp
def main():
st.subheader("Choi's ML Project")
st.markdown(html_temp, unsafe_allow_html=True) # main에 표 적용
menu = ['HOME', 'EDA', 'ML', 'About']
choice = st.sidebar.selectbox("Menu", menu)
if choice == 'HOME':
st.subheader('HOME')
st.markdown(dec_temp, unsafe_allow_html=True) # HOME 탭에 내용 적용
elif choice == 'EDA':
st.subheader('탐색적 자료 분석(EDA)')
pass
elif choice == 'ML':
st.subheader('머신러닝(ML)')
pass
else:
st.subheader('About')
if __name__ == "__main__":
main()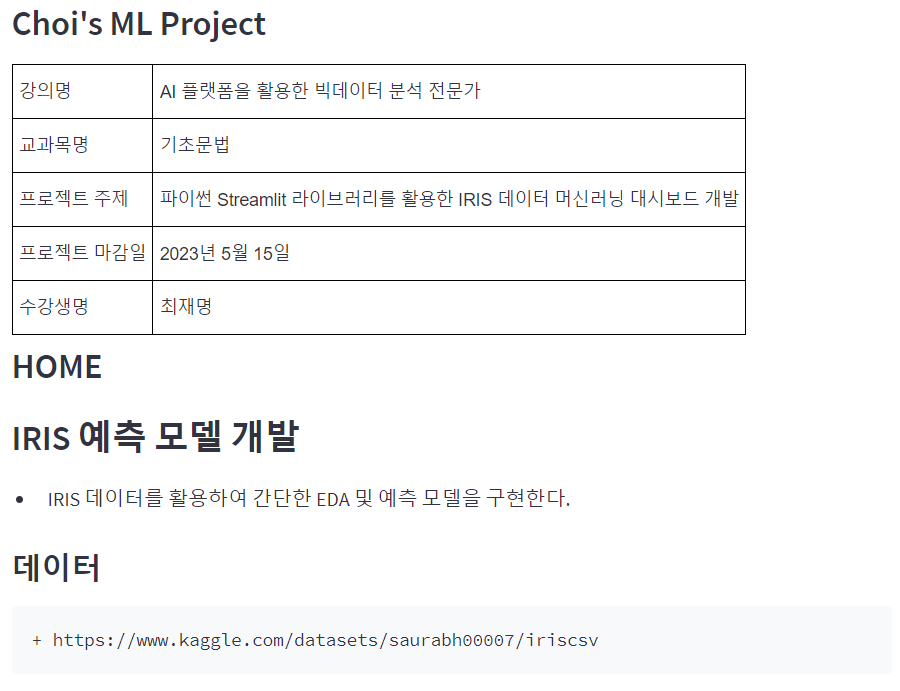
메인 페이지가 갖춰졌다.
5. EDA (탐색적 자료분석) 메뉴
- eda_app.py 파일 생성
- EDA에 들어갈 내용 확인
- 데이터 확인 (데이터 출력)
- 데이터 Type 확인
- 기초 통계량 (개수, 평균, 분산, 표준편차, 사분위수 등)
- Target 빈도수( 종별 개수 ) 확인
- Matplotlib, Seaborn을 활용한 시각화
- Plotly를 활용한 시각화
# eda_app.py
# -*- coding:utf-8 -*-
# 라이브러리 import
import streamlit as st
import pandas as pd
import matplotlib.pyplot as plt
import seaborn as sns
import plotly.express as px
import utils
def run_eda_app(): # run_eda_app() 함수 생성
st.subheader("탐색적 자료 분석")
iris = pd.read_csv('data/iris.csv') # 데이터 불러오기
st.markdown('## IRIS 데이터 확인')
st.write(iris) # 데이터 확인하기
# 메뉴 지정
# 사이드 바에 하위메뉴 생성
submenu = st.sidebar.selectbox('하위메뉴', ['기술통계량', '그래프분석', '통계분석'])
if submenu == '기술통계량': # 기술 통계량 메뉴 내용
st.dataframe(iris)
with st.expander('데이터 타입'):
result1 = pd.DataFrame(iris.dtypes) # 데이터 타입 확인
st.write(result1)
with st.expander("기초 통계량"): # 기초 통계량 확인
result2 = iris.describe()
st.write(result2)
with st.expander("Target 빈도 수 확인"): # 각 종별 개수 확인
st.write(iris['species'].value_counts())
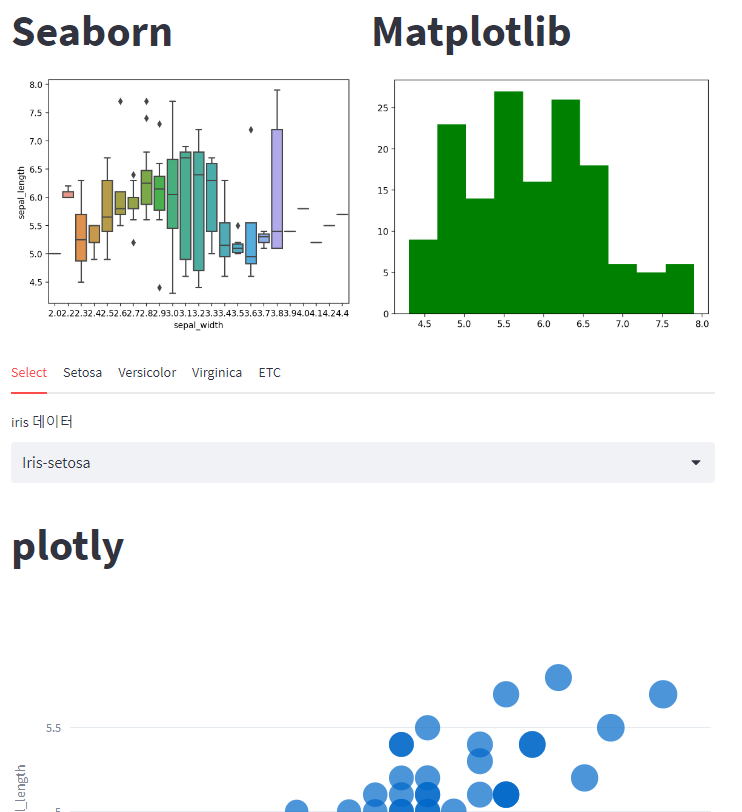
elif submenu == '그래프분석': # 그래프 메뉴 내용
st.title("Title")
with st.expander('산점도'):
fig1 = px.scatter(iris,
x = 'sepal_width',
y = 'sepal_length',
color = 'species',
size = 'petal_width',
hover_data = ['petal_length']) # Plotly 산점도 생성
st.plotly_chart(fig1) # 산점도 출력
# layouts 나누기
col1, col2 = st.columns(2)
with col1:
st.title('Seaborn')
fig, ax=plt.subplots()
# Seaborn 활용 상자그래프 작성
ax=sns.boxplot(iris,
x = 'sepal_width',
y = 'sepal_length',
ax=ax)
st.pyplot(fig)
with col2:
st.title('Matplotlib')
# Matplotlib 활용 히스토그램 작성
fig, ax=plt.subplots()
ax.hist(iris['sepal_length'], color='green')
st.pyplot(fig)
# Tabs
# iris의 종별 산점도 그래프 탭 만들기
# Plotly 사용
# 종 선택할 때마다 산점도 그래프가 달라지도록 함
tab1, tab2, tab3, tab4, tab5 = st.tabs(['Select','Setosa', 'Versicolor', 'Virginica', 'Kaggle'])
with tab1:
with tab1:
choice0 = st.selectbox('iris 데이터', iris['species'].unique())
result0 = iris[iris['species'] == choice0]
st.title('plotly')
# 그래프 작성
fig0 = px.scatter(result0
, x='sepal_width'
, y='sepal_length'
, size='sepal_width'
, hover_data=['sepal_length'])
st.plotly_chart(fig0)
with tab2:
st.write('Setosa')
choice1 = iris['species'].unique()[0]
result3 = iris[iris['species'] == choice1]
fig2 = px.scatter(result3,
x = 'sepal_width',
y = 'sepal_length')
st.plotly_chart(fig2)
with tab3:
st.write('Versicolor')
choice2 = iris['species'].unique()[1]
result4 = iris[iris['species'] == choice2]
fig3 = px.scatter(result4,
x = 'sepal_width',
y = 'sepal_length')
st.plotly_chart(fig3)
with tab4:
st.write('Virginica')
choice3 = iris['species'].unique()[2]
result5 = iris[iris['species'] == choice3]
fig4 = px.scatter(result5,
x = 'sepal_width',
y = 'sepal_length')
st.plotly_chart(fig4)
with tab5:
pass
elif submenu == '통계분석':
pass
else:
st.warning("뭔가 없어요!")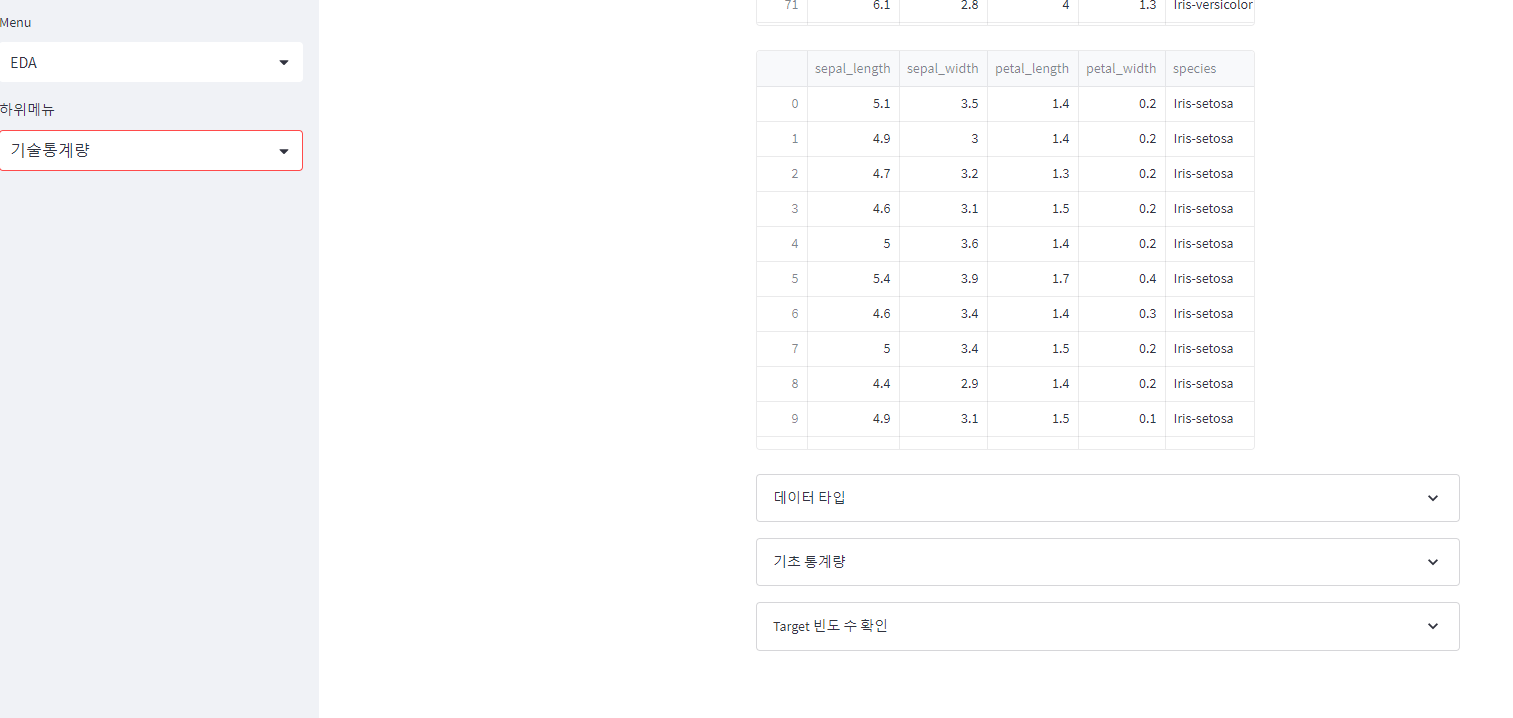
6. ML(머신러닝) 학습 모델 생성
- model.py 파일 생성
- ML 학습 모델 생성
- sklearn 패키지 활용
- Logistic 회귀분석을 활용한 ML 학습 모델 생성
- joblib를 활용한 모델 저장
# model.py
# -*- coding:utf-8 -*-
import pandas as pd
from sklearn.preprocessing import LabelEncoder
from sklearn.model_selection import train_test_split
from sklearn.linear_model import LogisticRegression

import joblib # 모델 저장 또는 불러올 때

data = pd.read_csv("data/iris.csv")
le = LabelEncoder()
print(le.fit(data['species']))
data['species'] = le.fit_transform(data['species'])
print(le.classes_) # ['Iris-setosa' 'Iris-versicolor' 'Iris-virginica']

X = data.drop(columns = ['species'])
y = data['species']
X_train, X_test, y_train, y_test = train_test_split(X, y, test_size = 0.25)

model = LogisticRegression()
model.fit(X_train, y_train)

# 모델 만들고 배포 (Export)
model_file = open("models/logistic_regression_model_iris_230425.pkl","wb")
joblib.dump(model, model_file)
model_file.close()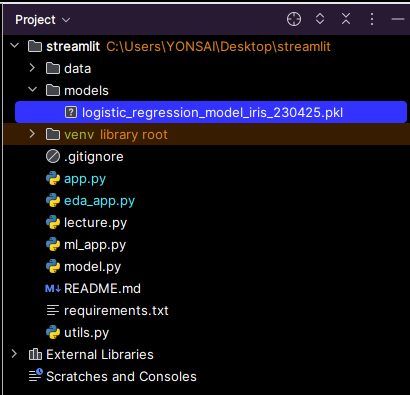
7. ML(머신러닝) 메뉴
- ML 내용이 들어간 ml_app.py 파일생성
- ML에 들어갈 내용 확인
- ML 학습 모델 불러오기 및 적용
- 슬라이더를 활용한 임의 데이터 입력
- 입력된 임의 데이터로 예측한 결과값 출력
# ml_app.py
# -*-coding: utf-8 -*-
import streamlit as st
import joblib
import os
import numpy as np

def run_ml_app():
    st.title("머신러닝 페이지")
    col1, col2 = st.columns(2)
    with col1:        # 슬라이더를 통한 각 Feature별 임의 데이터 입력
        st.subheader("수치를 입력해주세요.")


        sepal_length = st.select_slider("Sepal Length", options=np.arange(1, 11))
        sepal_width = st.select_slider("Sepal Width", options=np.arange(1, 11))
        petal_length = st.select_slider("Petal Length", options=np.arange(1, 11))
        petal_width = st.select_slider("Petal Width", options=np.arange(1, 11))

        sample = [sepal_length, sepal_width, petal_length, petal_width]
        st.write(sample)

    with col2:		# 모델 예측값 출력
        st.subheader("모델 결과를 확인해주세요!")
        new_df = np.array(sample).reshape(1, -1)
        st.write(new_df.shape, new_df.ndim)

        # 모델 불러오기
        MODEL_PATH = 'models/logistic_regression_model_iris_230425.pkl'
        model = joblib.load(open(os.path.join(MODEL_PATH), 'rb'))


        # 예측값 출력 탭
        prediction = model.predict(new_df)
        pred_prob = model.predict_proba(new_df)
        st.write(prediction)
        st.write(pred_prob)

        if prediction == 0:
            st.success("Setosa 종입니다. ")
            pred_proba_scores = {"Setosa 확률": pred_prob[0][0] * 100,
                                 "Versicolor 확률": pred_prob[0][1] * 100,
                                 "Virginica 확률": pred_prob[0][2] * 100}
            st.write(pred_proba_scores)
            st.image('https://upload.wikimedia.org/wikipedia/commons/thumb/a/a7/Irissetosa1.jpg/220px-Irissetosa1.jpg')

        elif prediction == 1:
            st.success("Versicolor 종입니다.")
            pred_proba_scores = {"Setosa 확률": pred_prob[0][0] * 100,
                                 "Versicolor 확률": pred_prob[0][1] * 100,
                                 "Virginica 확률": pred_prob[0][2] * 100}
            st.write(pred_proba_scores)
            st.image(
                'https://upload.wikimedia.org/wikipedia/commons/thumb/2/27/Blue_Flag%2C_Ottawa.jpg/220px-Blue_Flag%2C_Ottawa.jpg')

        elif prediction == 2:
            st.success("Virginica 종입니다.")
            pred_proba_scores = {"Setosa 확률": pred_prob[0][0] * 100,
                                 "Versicolor 확률": pred_prob[0][1] * 100,
                                 "Virginica 확률": pred_prob[0][2] * 100}
            st.write(pred_proba_scores)
            st.image(
                'https://upload.wikimedia.org/wikipedia/commons/thumb/f/f8/Iris_virginica_2.jpg/220px-Iris_virginica_2.jpg')
        else:
            st.warning("판별 불가")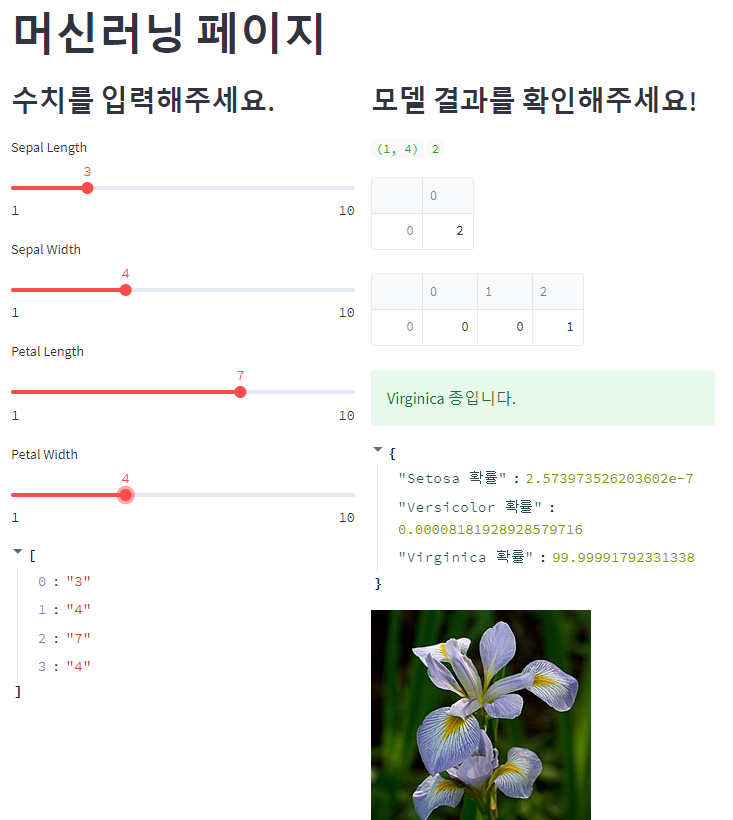
8. 모든 페이지를 Main 페이지에 적용하기
- app.py에서 모든 페이지 내용 import 시키기
- eda_app.py
- ml_app.py
# -*- coding:utf-8 -*-
import streamlit as st
from utils import html_temp
from utils import dec_temp
from eda_app import run_eda_app
from ml_app import run_ml_app
def main():
    st.subheader("Choi's ML Project")
    st.markdown(html_temp, unsafe_allow_html=True)

    menu = ['HOME', 'EDA', 'ML', 'About']
    choice = st.sidebar.selectbox("Menu", menu)

    if choice == 'HOME':
        st.subheader('HOME')
        st.markdown(dec_temp, unsafe_allow_html=True)
    elif choice == 'EDA':
        run_eda_app()
    elif choice == 'ML':
        run_ml_app()
    else:
        st.subheader('About')


if __name__ == "__main__":
    main()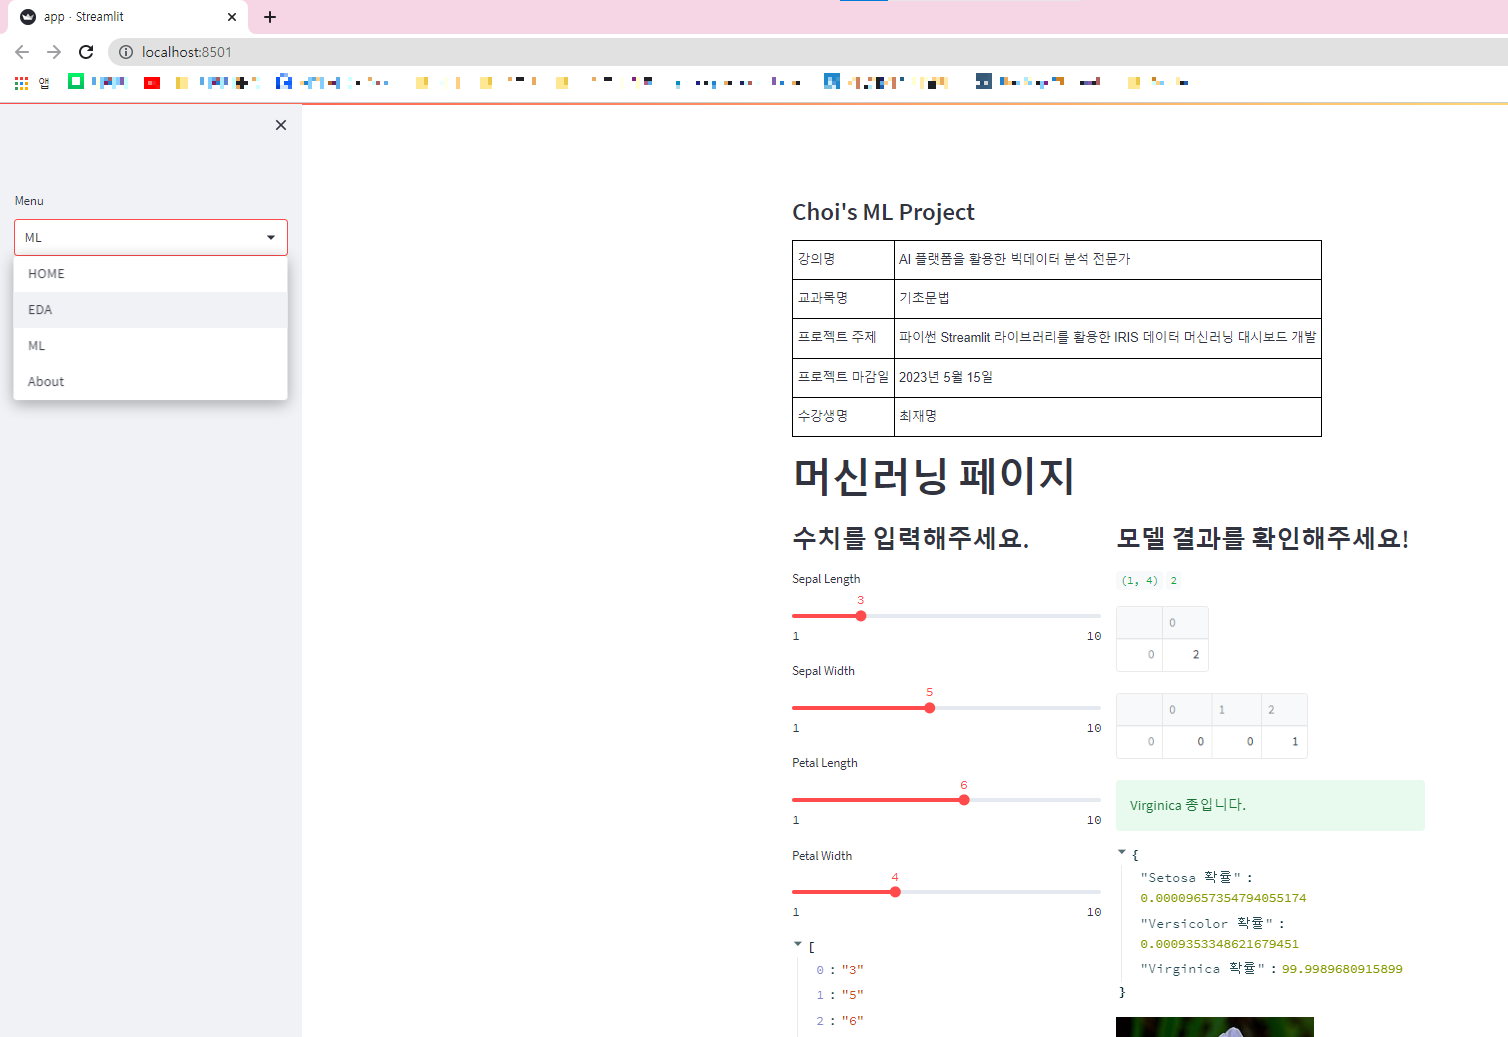
9. 실습을 마치며
Streamlit을 통해 Python 작업 내용을 쉽게 배포할 수 있게 되었다.
앞으로도 여러 가지 시각화 및 머신러닝 작업 후에 배포까지 해보도록 하겠다.
728x90
반응형
'Python > 실습' 카테고리의 다른 글
| [Python 통계 분석 실습] 2. Independent-Sample(독립표본) T-TEST (0) | 2023.04.30 |
|---|---|
| [Python 통계 분석 실습] 1. Z-TEST & One-Sample T-TEST (0) | 2023.04.27 |